Author Archives: Jordan Berke

Want a Free RepOne Sensor? Take Our ‘How Do You Coach’ Surveys!

RepOne isn’t a product, it’s an ecosystem. The degree to which you’ll enjoy RepOne will depend on how well we do the big things like VBT and Autoregulation, as well as the little things like scheduling workouts or handling warm-ups. There’s an enormous amount of nuance in these tasks, particularly when a system automates them to the degree RepOne does. That’s why our surveying is so important.

We’ve worked with teams for years in essentially every sport and every level of sport, but there are so many questions to ask. To incentivize  this gift of knowledge, we’re giving away a free RepOne Sensor to a random individual who has completed the most surveys. They’re only a couple minutes long each, so what do you have to lose? You can find each survey below.

Scheduling Workouts (New Survey!)

How do you go about communicating weight room activities to your athletes, and how do you deal with issues that arise?

Take the survey here

What matters during a workout?

If you’re a coach, what are you doing while your athletes are training? What are you paying attention to? What are the top things you want visibility on?

How do you instruct warm-ups for weighted exercise?

Coaches generally employ some sort of pyramid progression to work up to training loads for weighted exercise (eg. bar, 25%, 40%, 55%, 65%, 70%). How do you fit this into your programming?

How do you group athletes in a rack?

In a team setting, athletes are usually grouped together to share a rack or training station for an exercise. How do you group your athletes?

How will you use velocity information in your athletes training?

If you already use velocity, how does that information translate to training decisions?

Take the survey here

Autoregulation at Scale — How RepOne Individualizes Velocity Targets

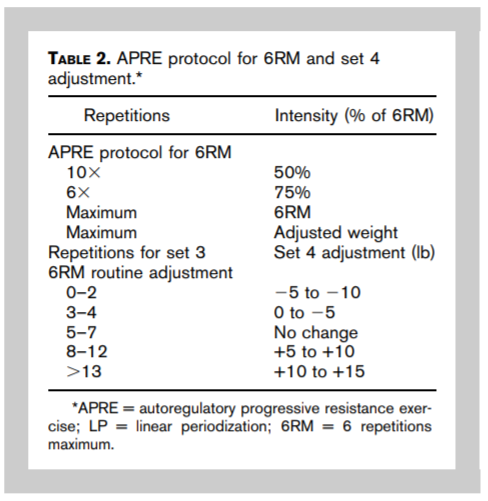
Implementing autoregulated principles on a team scale isn’t trivial. At the surface the problem is relatively approachable, with simple tools like APRE templates, 1RM calculators, or VBT devices a coach can prescribe a relatively simple program to a team and athletes can start regulating their training loads without any specific preparation. The caveat in the above methods is in the philosophy.

Autoregulation taken to its logical conclusion is simple to describe. The coach always knows the athlete’s current strength level, and the training stimulus is reflective of that information. Hidden in that simple phrase is something deviously complex:

The coach always knows the athlete’s current strength level

It is impossible to imagine a future technology that will enable the coach to not only perfectly assess the athletes strength level, but also do so at all times. This is reminiscent of my days as a Control Systems Engineer for Pratt & Whitney, where we would attempt to do the same with something many orders of magnitude less complex than a human athlete, a jet engine.

To build a system that can optimally control a jet engine we try to do the same thing as a strength coach, we assess the engines current state and make adjustments in anticipation or in reaction to an external stimulus, and measure the results. Control theory was developed in the 19th century to aid in the design of new industrial mechanisms, and over the years it’s gotten quite good at solving these kinds of problems.


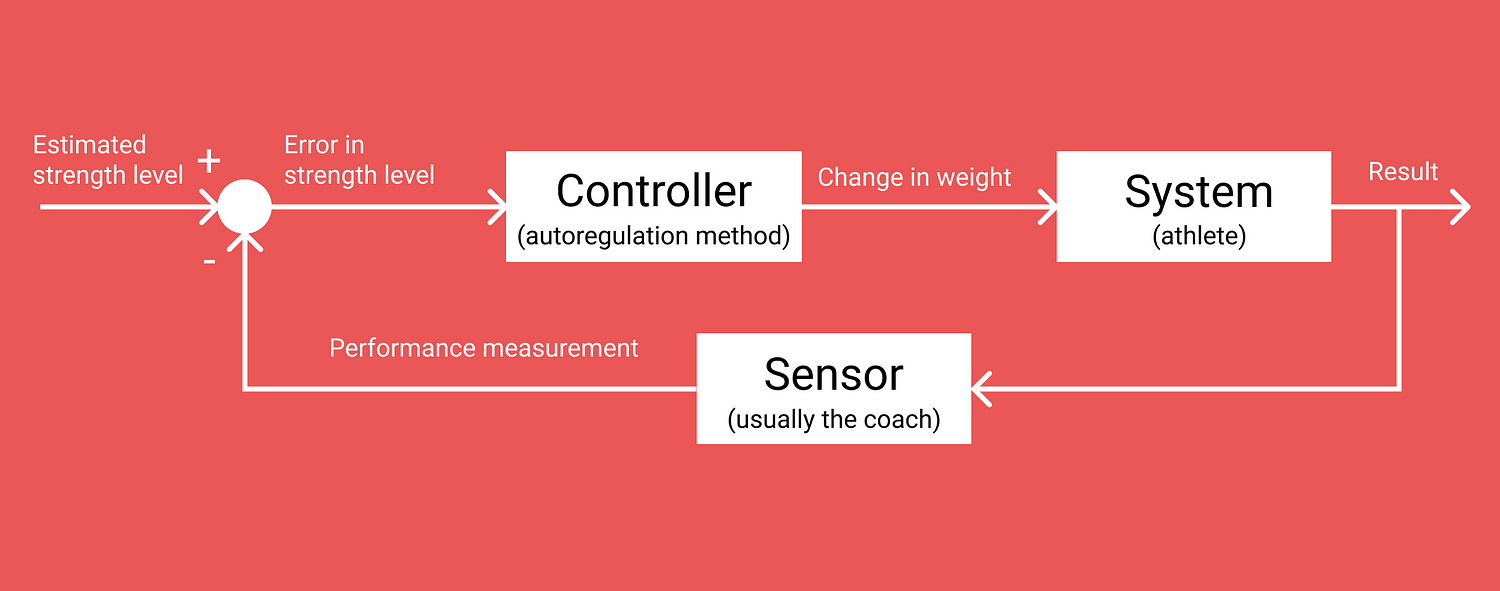
The athlete-coach feedback loop


This image represents the athlete-coach feedback loop in an autoregulated, individualized training program. The coach begins with a preconceived notion of the athletes strength, and on the first set has no choice but to use that old data to make the first training decision, since no input has given the coach any opportunity to take a ‘measurement’. The coach employs whichever autoregulation method of choice to choose the training load, the athlete responds, and the coach makes their first assessment. Usually, since the athlete starts at lighter weights, it’s to go up in weight.

As the workout progresses and these micro-decisions get made, the coach with the help of their ‘Controller’ eventually arrives at the days training weight.

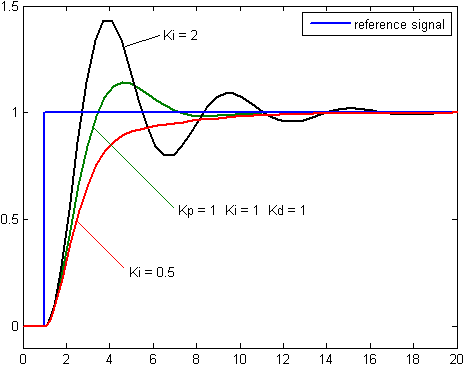
The signal response for a PID controller

The above signal response graph demonstrates our issue. The blue line is our athlete, and zero is the athletes estimated level of strength. This graph is showing what’s called a ‘step function’, or an immediate increase in our athletes strength level, which is suitable to model a change in strength between two training sessions.

The black, green, and red lines are different autoregulatory methods (Controllers) responding to this perceived immediate increase in athlete strength level, each automatically adjusting to give the athlete training loads appropriate to this new strength.

Each approach has its drawbacks. The black method overshoots too far, potentially putting a load on the bar that’s too heavy even for your stronger-than-yesterday athlete. The red method undershoots, and the athlete only does one set in the ‘ideal’ range at the end of the workout. The green line is the closest of the three, oscillating around our ideal training load, sometimes over and under-shooting but within a reasonable amount.

Our elusive perfect solution would essentially mirror the athlete, with the ‘Result’ layered directly on top of the blue athlete line. The number one reason this will never happen, is time. It’s the reason Segways fall over, self-driving cars inevitably kill people, or even why you tripped on that step that you knew was there. The sensors we use to process data (our eyes) and the processors we use to interpret this data (our brains) have some sort of inevitable time delay, or delta, between the real world and our actions.

RepOne ‘Controllers’ continuously updating in the background

From the point of view of our athlete-coach feedback loop we have an inability to sense the athlete’s strength between sessions, during off days, or even between sets, so our actions are always late. That doesn’t mean we can’t do something about it. A system like RepOne, with tight integration between sensors and software, can create these ‘Controllers’ in the background, feeding updated data back into our control loop as it comes in.

At this stage, our challenge is in developing better controllers and sensors. The RepOne device, with its unmatched 3D sensing and linear accuracy is as good as sensing gets at the moment. When fed into the RepOne Athlete App we can keep the time delta low, recording data on each set and integrating it into our data models. OpenBarbell has given us a great head start, with about a million data points we can use to develop our approaches, and we’re looking forward to the wealth of data we’ll have access to when RepOne ships next year.

The RepOne Alpha Program has reached its half way point!

The RepOne software has made some incredible progress in the last few months. We’ve been working closely with our Alpha program participants in developing tools that not only consolidate things like paper workout cards, excel spreadsheets, and disparate roster systems, but enable things that were previously not possible.

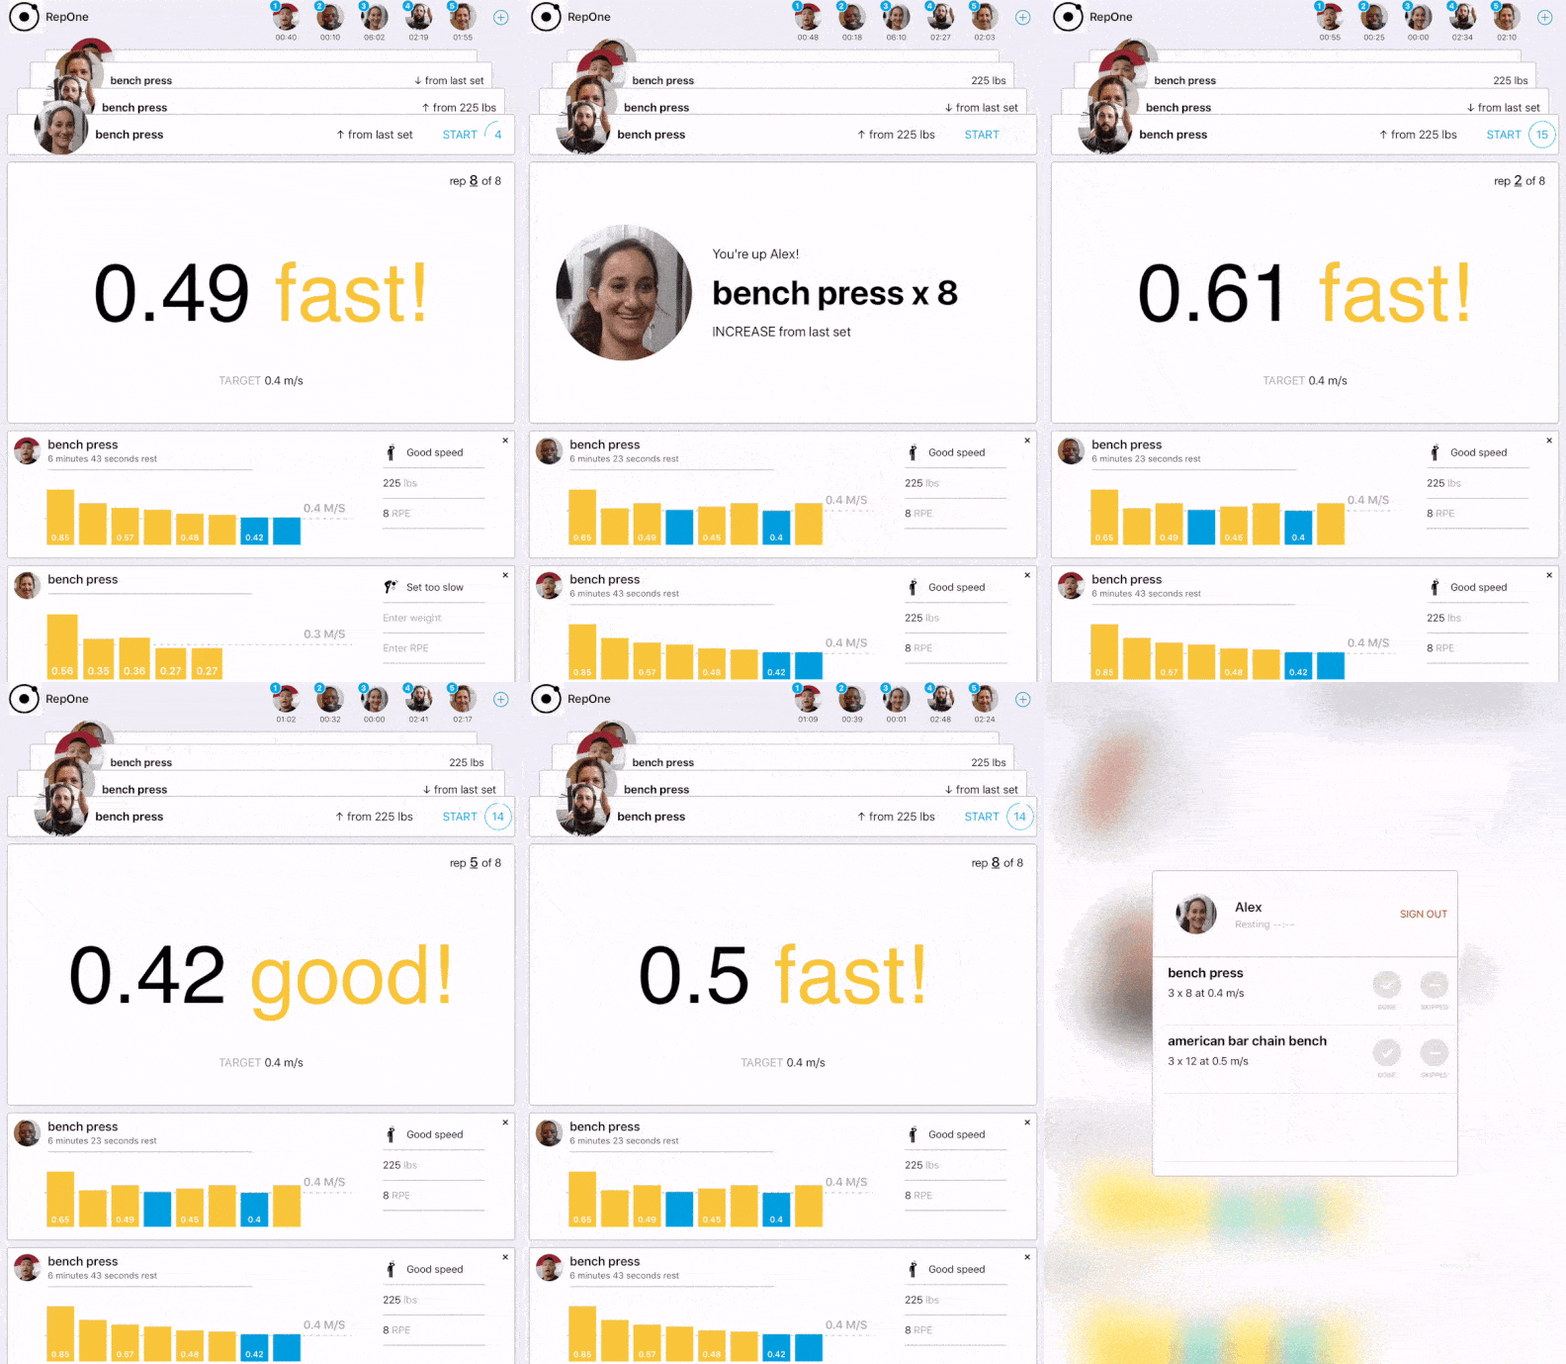
Here’s a quick preview of the iPad Athlete Kiosk app and browser based Coaching Portal.

In the Athlete Kiosk app you can see the general flow of athletes working in with each other on a rack. The history of the rack is below, upcoming is on top, and the current athlete has the most important data front and center. When an athlete finishes their set they can log the weight (if it isn’t pre-specified) and optionally log their perceived exertion. If the athlete is working with velocity, guidance will be given for their next set based on whether they were above or below their speed targets.

You can also see our ‘athlete card’ view at the end. If an athlete wants to get a high-level overview of their workout, or log non-tracked exercises like walking lunges or push-ups, they can tap their face on the top right.

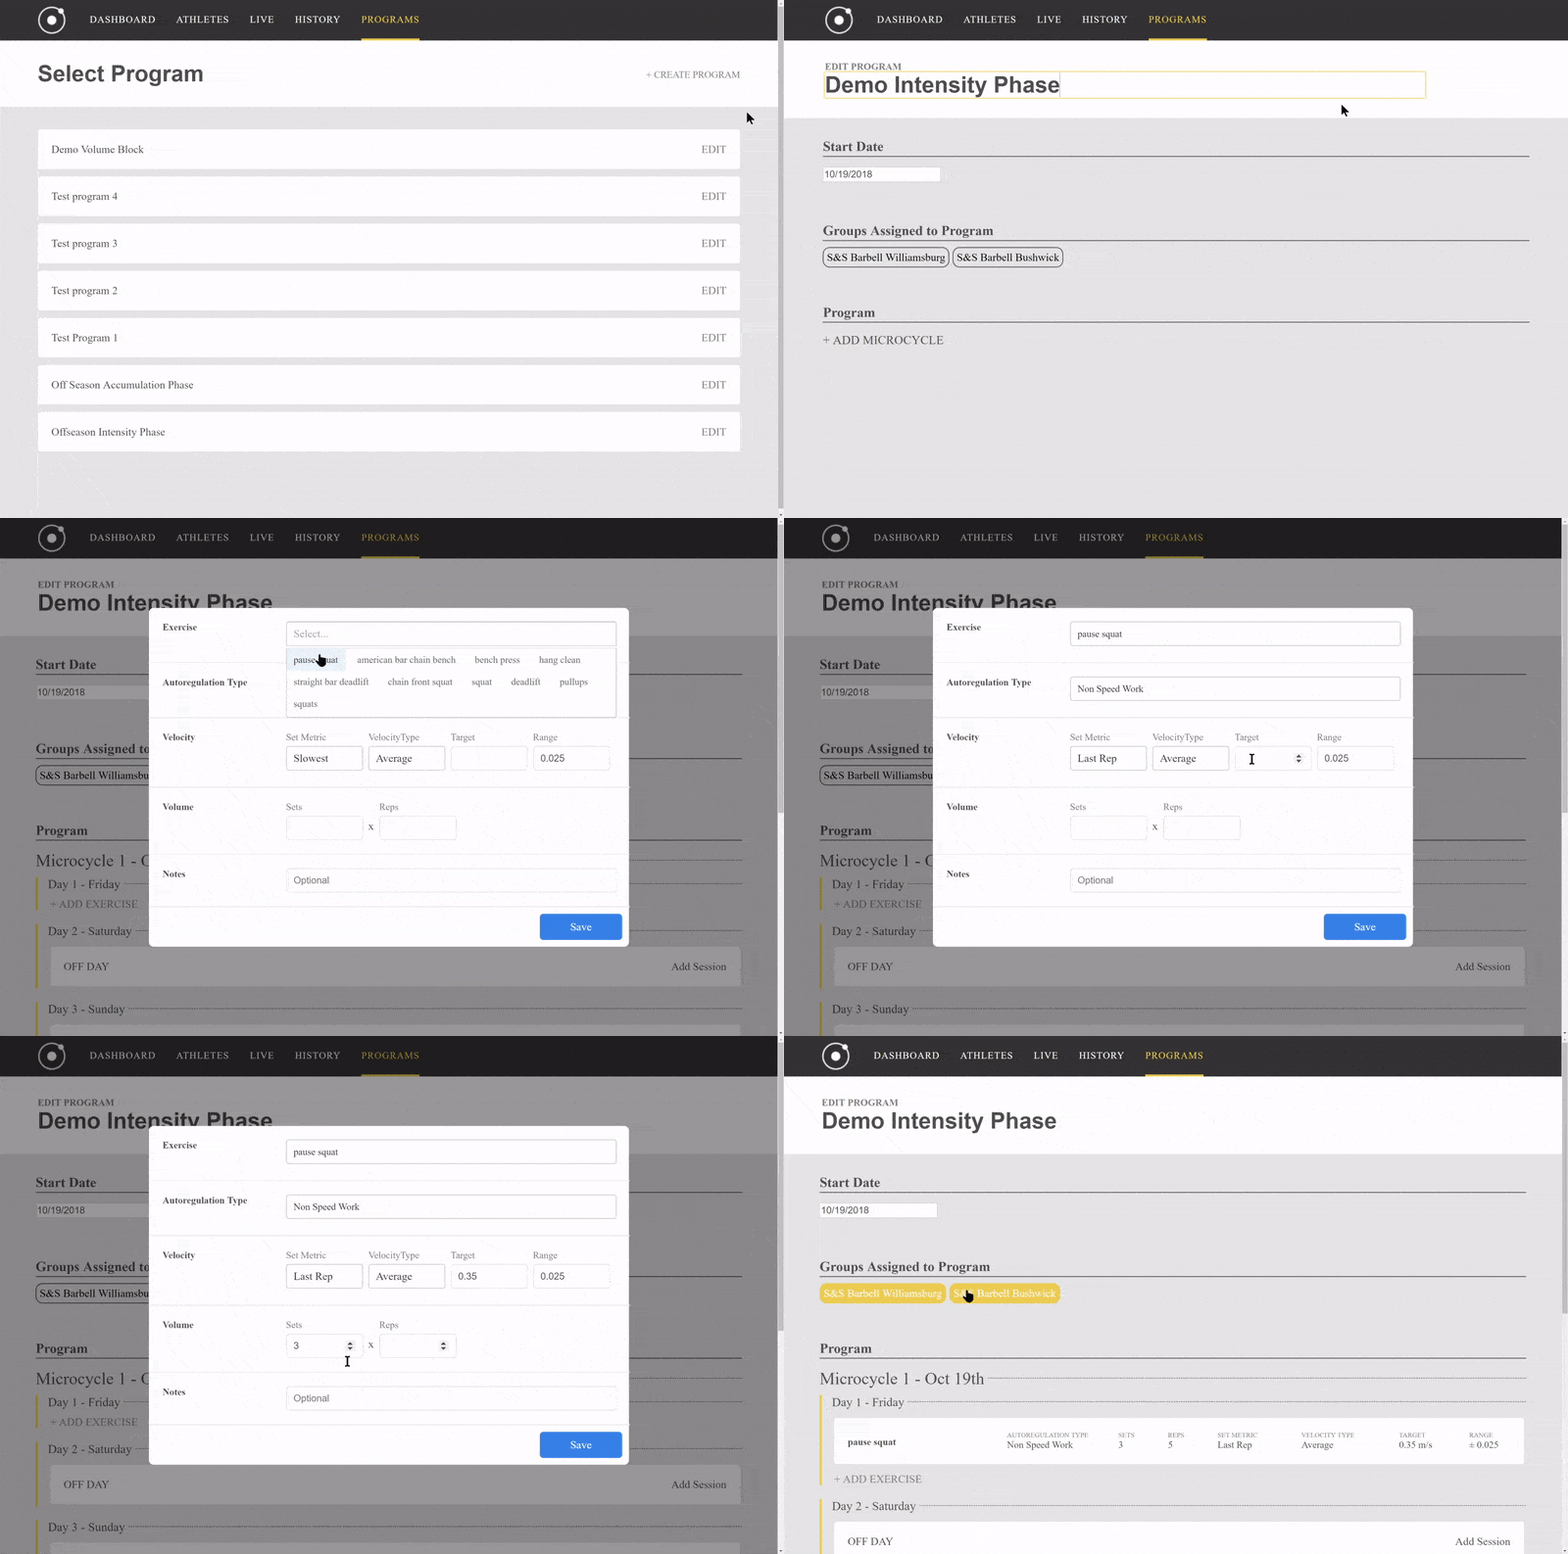
The RepOne Coaching Portal is enjoying some workflow attention. We’ve heard feedback from our alpha participants on optimizing our workout builder, so we’re hard at work on building some of the best features of Excel into a browser based tool, like drag and drop and copy/paste.

You can see current capabilities of the portal include simple workout creation, exercise selection and customization, tight integration with velocity guidance, group assignment, and more. It has a fully capable roster system, and future alpha versions will include athlete status pages that the coach can dig into for individualized insights.

This is just the half way point. We have some things on our roadmap that we’re very excited about, and our development speed is only improving. Keep an eye out for more updates as we get prepare to announce official launch dates!


Our fourth ‘How Do You Coach’ survey: What matters during a workout?

RepOne isn’t simply a planning app or analysis software, it’s the operating system for your weight room. If we you had the ability to bring a wealth of weight room data to your fingertips mid-workout, what would matter most?

Here is the latest survey.

Did you miss the previous surveys? Catch up below!

Here is survey #1

Here is survey #2

Here is survey #3

Two Ways Data Science is Changing the Future of the Weight Room

There are some amazing things developing in S&C…

A few of which we’ve summarized in our blog post about what we call ‘Motion Based Training’. Innovations that help us make sense of the training information that surrounds us will increasingly become paramount to success. Sports tech has been focused primarily on lagging indicators for years and products have gotten great at measuring and tracking in-game performance, but the time spent in-game is a small fraction of the time an athlete is performing. The relative lack of leading indicators has many reasons, not least among them is a lack of powerful data science.

In the effort of being proactive about our coaching rather than reactive, we need to be as far upstream as possible, which means collecting many pieces of data that can impact an athlete on game day. Recording meaningful data is a challenge, as devices like RepOne are only starting to deliver the necessary technology to teams, but once that barrier is cleared, making sense of it is the real challenge.

Lifter Clustering

This is a project we’ve been looking forward to since we started collecting lifting data. Lifter Clustering is the process of grouping athletes by specific traits in order to infer differences in performance with greater accuracy.

“What if we could analyze all the lifters in our database, determine natural groupings based on their performance metrics and create multiple versions of the [velocity calibration tables] for each distinct lifter profile?”

Lifter Clustering takes a non-traditional approach to exercise research, as it relies on a very non-traditional data source. The average strength study consists of something like 10 or 20 participants and lasts 4–6 weeks, where anything longer or bigger becomes exponentially more time intensive and costly. Where randomized controlled trials are highly supervised and precise, the OpenBarbell database is comparatively immense and longitudinal.

For example, rather than running a controlled study on the impact of long arms on bench press 1RM progress in beginner athletes, we look up the reverse. What were the ROMs on bench that correlated to low, moderate, and fast strength gain? Were there other factors that made longer armed lifters more likely to increase their strength? Were there a confluence of factors? Finally, if we observe these factors in a completely separate data set, do we have the same findings?

As our database increases in size, number of tracked metrics, types of metrics, and surrounding environmental data (limb lengths, sleep duration, etc.) we can start making sense of how the wide variety of factors that impact training work together to set PR’s.

Exercise Classification

Exercise classification is just as much for us as it is for you. A good chunk of our database is unclassified, which means we can’t currently use a sizable amount of our overhead press data because there’s no way for us to know that it is indeed an overhead press. It’s also useful during your workouts, as an athlete that logs less can focus more on their training. Once workout programs are uploaded to the RepOne Coaching Portal the system knows what an athlete is doing, but if he/she goes off program, we can get them back on course without requiring athlete input.

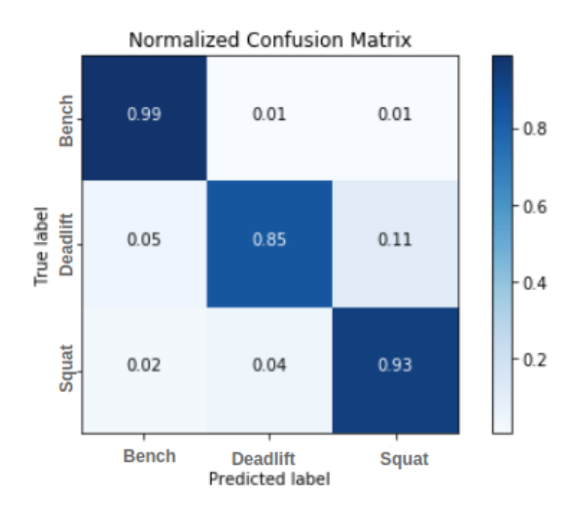
Initially we didn’t think one dimensional position data could tell us enough to infer exercise type, but our talented data scientist Yulia found some promising avenues. This isn’t brand new tech, but executing exercise classification at the accuracy our customers require is quite different than what your Apple Watch can do. As 3D sensing becomes more prevalent these estimations will become more capable, leading to features like genuinely useful automated form critique.

Have you taken our ‘How Do You Coach’ Surveys?

If you haven’t, you’re missing out on a chance to win a free RepOne device. Everybody who fills out all of our surveys is eligible to win one of the most advanced training tools in the world. Check the links below!

Here is the latest survey.

Here is survey #1

Here is survey #2

Calibrate Your Strength

About two months ago we wrote about an observational study we conducted at S&S Barbell. One of the main outcomes of that study was velocity and %1RM calibration tables for squats and bench press. Our white paper described our process and included some tools to create your own calibration table, but it didn’t go into great detail about how to use those tools. This tutorial will provide more complete guidance on how to set up these tables.

Before changing anything

The main calibration tables are located on tab #3 (Calibration) of the linked Google Sheets document. However before changing anything in the document, make sure to create a copy of the file with:

File -> Make a Copy

You do not need to “Request Access” to make the copy.

Then fill out the setup tabs

To create customized calibration tables for squat and bench press you will need to fill out tabs #1 (Squat Set up) and #2 (Bench Set up). You do not need to change anything on tab #3 (Calibration). Hence, it’s blocked for editing.

Squat and Bench Setup tabs have the same layout (but different underlying calibration parameters). They are designed to be filled with sets of 1 to 10 reps at RPEs from 6 to 10 at 0.5 increments. You do not need to fill out all 90 cells. However, the more cells you fill out, the more customized to you the calibration table will be. If more than one set was performed at a certain rep/RPE combination, fill in simple averages of velocity or weight for the appropriate cell (see example later in this post).

Depending on the tools available (i.e., velocity measurement device) and training program specifics, you can fill out either observed velocity or observed weight setup tables (or both).

Option 1: Calibrate Velocity

On squat and/or bench setup tabs, fill out only the observed velocity table (the one on the left) with the velocity metric of your choice (see below). Ignore weight table on the right.

You can use any of the following velocity metrics:
– Peak-end (average of slowest rep and last rep average velocities) or
– Slowest rep average velocity or
– Last rep average velocity

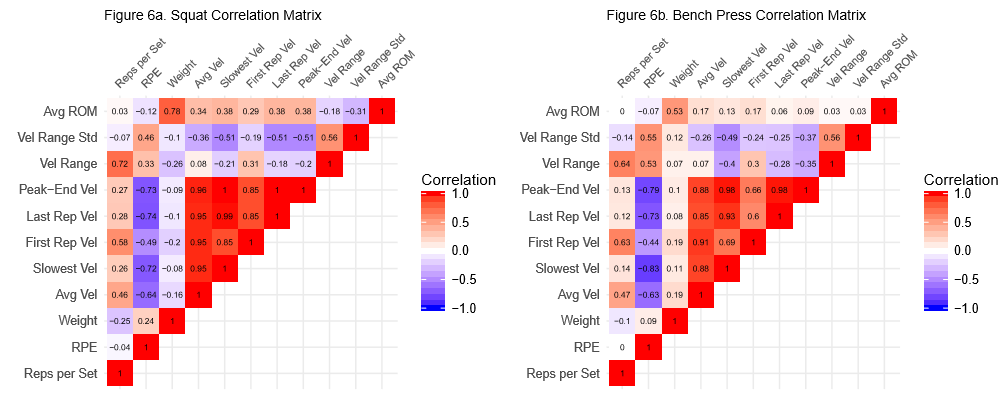
Peak-end, slowest, and last rep are all roughly equally correlated to RPE.

As demonstrated in our white paper, all three metrics should be very similar (sometimes even the same, it depends on the lifter). Hence, it does not matter significantly which one you pick.

Option 2: Calibrate %1RM

On squat and/or bench setup tabs, fill out only the observed/lifted weighttable (the one on the right) with lbs or kgs (as long as it is the same units for all cells). Ignore velocity table on the left.

Copy calibration tables

That’s it! Copy the appropriate tables from the “Calibration” tab into a any other tool of your choice, and use it as a reference to choose the perfect training load. Reminder, do not change anything on this tab.

Example 1: Velocity calibration

Step 1. Make a copy of the file as instructed above
Step 2. Retrieve athlete’s data for squats from historical records:

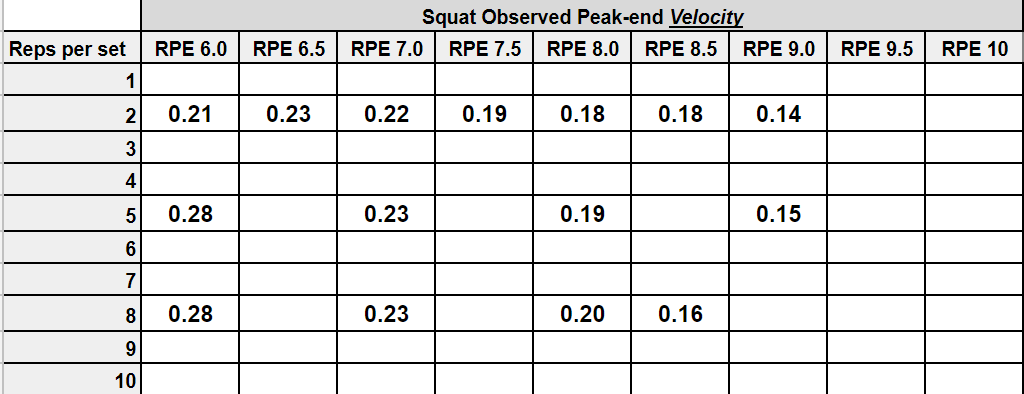
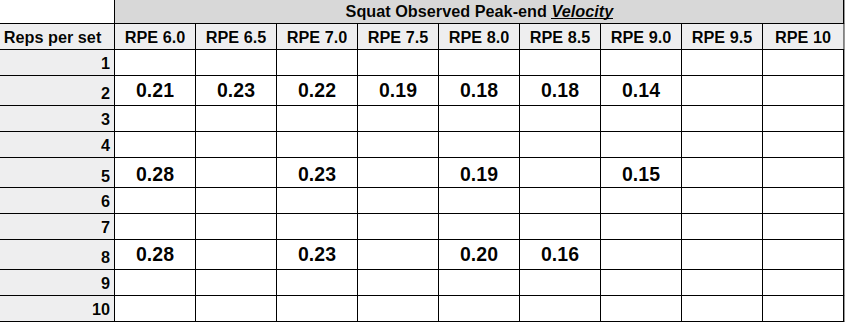
1 set of 2 @RPE 6.0 Last-rep velocity: 0.21
1 set of 2 @RPE 6.5 Last-rep velocity: 0.23
1 set of 2 @RPE 7.0 Last-rep velocity: 0.22
1 set of 2 @RPE 7.5 Last-rep velocity: 0.19
1 set of 2 @RPE 8.0 Last-rep velocity: 0.18
1 set of 2 @RPE 8.5 Last-rep velocity: 0.18
1 set of 2 @RPE 9.0 Last-rep velocity: 0.14
2 sets of 5 @RPE 6.0 Last-rep velocity: 0.28 (average for 2 sets)
2 sets of 5 @RPE 7.0 Last-rep velocity: 0.23 (average for 2 sets)
2 sets of 5 @RPE 8.0 Last-rep velocity: 0.19 (average for 2 sets)
2 sets of 5 @RPE 9.0 Last-rep velocity: 0.15 (average for 2 sets)
1 set of 8 @RPE 6.0 Last-rep velocity: 0.28
1 set of 8 @RPE 7.0 Last-rep velocity: 0.23
1 set of 8 @RPE 8.0 Last-rep velocity: 0.20
1 set of 8 @RPE 8.5 Last-rep velocity: 0.16

The resulting squat velocity setup table will look like this:

Step 3. Copy the resulting squat velocity calibration table (from the 3rd tab, on the left side of the sheet) into your training protocol. It should look like this:

Step 4. Repeat step 2 and 3 for bench velocity setup table.

Example 2: %1RM calibration

Step 1. Copy the file
Step 2. Retrieve athlete’s data for squats:

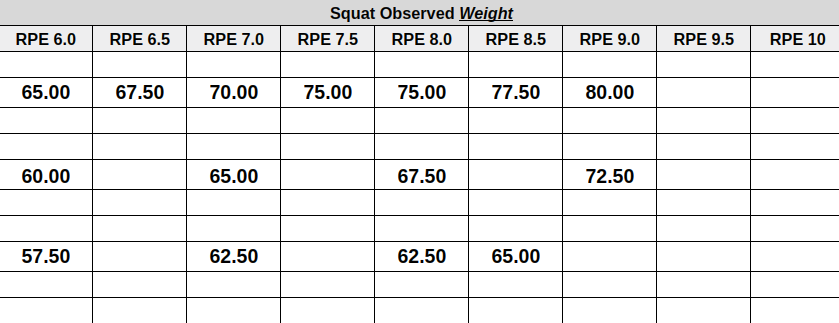
1 set of 2 @RPE 6.0 Last-rep velocity: 65.0 kg
1 set of 2 @RPE 6.5 Last-rep velocity: 67.5 kg
1 set of 2 @RPE 7.0 Last-rep velocity: 70.0 kg
1 set of 2 @RPE 7.5 Last-rep velocity: 75.0 kg
1 set of 2 @RPE 8.0 Last-rep velocity: 75.0 kg
1 set of 2 @RPE 8.5 Last-rep velocity: 77.5 kg
1 set of 2 @RPE 9.0 Last-rep velocity: 80.0 kg
2 sets of 5 @RPE 6.0 Last-rep velocity: 60.0 kg (average for 2 sets)
2 sets of 5 @RPE 7.0 Last-rep velocity: 65.0 kg (average for 2 sets)
2 sets of 5 @RPE 8.0 Last-rep velocity: 67.5 kg (average for 2 sets)
2 sets of 5 @RPE 9.0 Last-rep velocity: 72.5 kg (average for 2 sets)
1 set of 8 @RPE 6.0 Last-rep velocity: 57.5 kg
1 set of 8 @RPE 7.0 Last-rep velocity: 62.5 kg
1 set of 8 @RPE 8.0 Last-rep velocity: 62.5 kg
1 set of 8 @RPE 8.5 Last-rep velocity: 65.0 kg

The resulting squat %1RM setup table:

Step 3. Copy the resulting squat %1RM calibration table (from the 3rd tab, on the right side of the sheet) into your training protocol:

Step 4. Repeat step 2 and 3 for bench %1RM setup table.

Now squat and bench with precision!

Building Context With VBT – A White Paper By The RepOne Strength Team

Background

About a year ago we noticed an issue in our OpenBarbell data set. Although a lot of people logged RPE, it wasn’t consistent or plentiful enough to tackle a lot of the data science problems we thought were most interesting. One of the most fascinating aspects of Motion Based Training is the fact that we can correlate subjective measures like perceived exertion with objective measures like velocity. We decided to start an internal data collection study at S&S Barbell, our testing facility, to fill in these gaps, and began initial work on some initiatives that are important for RepOne. We wanted to share the results of this initiative with our waitlist.

Purpose

The initial purpose of collecting this data was to build better computational models of athletes. If we could fully characterize an athlete via motion data, we could help coaches make more informed decisions about training loads and overall progress. Furthermore if we can minimize the amount of data we need to build athlete models with high confidence, we can reduce the amount of time from installation of RepOne to full utilization.


Part of our methodology involves creating RPE/Velocity Calibration Tables, which can be a relatively simple way to build an actionable athlete model. The Building Context White Paper includes a a few handy tools like the reference Calibration Tables above, individualized tables, and tools to generate your own. We believe they can be useful in a team weight room today.

How to Read the White Paper

The paper is not a piece of scientific research, rather it is a presentation of our ideas along with a few tools to make it easier for you to replicate our methods if you so choose. We believe there is a lot of progress to be made in building fast, accurate athlete profiles, and are always working to improve. The information presented in our paper gives coaches another option in implementing VBT strategies with resources that are currently available, as RepOne is awaiting release.

‘How Do You Coach’ Survey #2

This is the second survey in our ‘How Do You Coach” series, this time the topic is how you group athletes in a rack. You can find the first survey here.

If you want a chance to win one free RepOne device when we launch, you can choose to add your email address in the form below. The individual who fills out the most surveys when we ship our first batch will win. If multiple people filled out all of our surveys we’ll pick one person from that group at random.

Click here to fill out the second survey, and have a chance to win a free RepOne!

Velocity/RPE Calibration Table Whitepaper 🔢 , ‘How Do You Coach’ Survey, and More

Although having a database of about a half million reps is nice, some of the data science we do at RepOne Strength depends on a high degree of accuracy and dependability. When we clean our database of dubiously titled exercises and sets with “bands” or “chains” tagged, or a multitude of other conflating factors, half a million quickly turns into a few thousand.

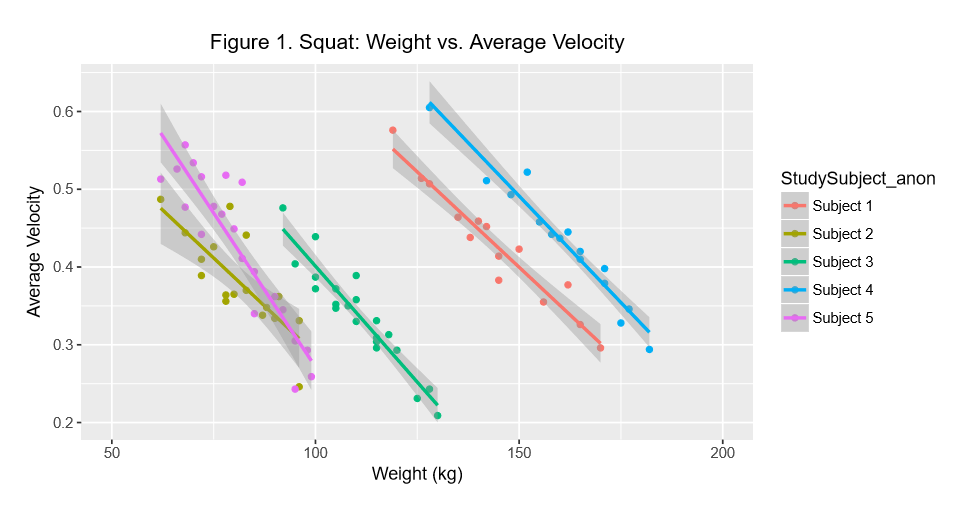
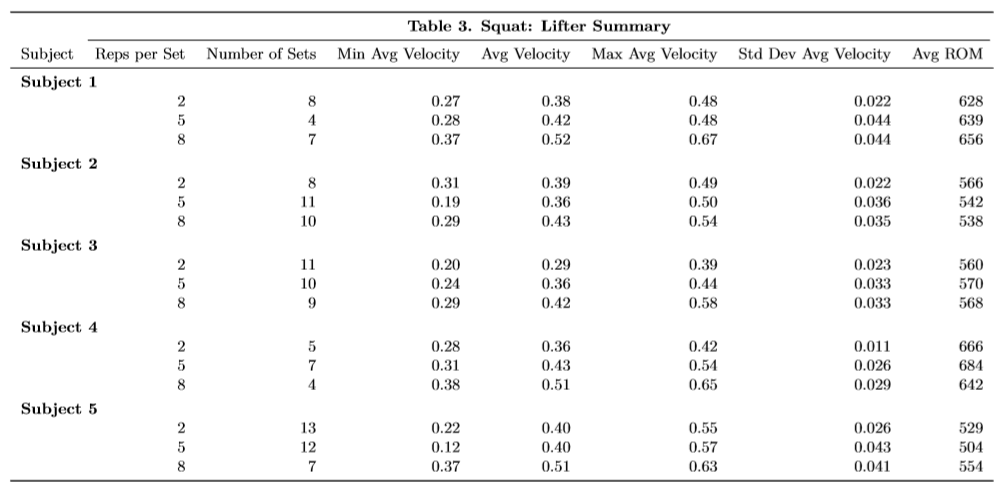
When we started our initiative to find the smallest amount of data we need to build dependable exertion models for individual athletes, we decided to supplement this data shortage with a fully observed study at our facility S&S Barbell. Our study protocol shrunk data collection by about 80% and resulted in valid individualized athlete data models and load velocity curves. We also built a few tools to streamline this process in the future.

Study data overview of our first five subjects

We’re not quite done with data collection, but a few of our customers have shown interest in building these models themselves. We’ll be releasing these tools in the form of a whitepaper to people who sign up for updates on the RepOne Strength website. Along with the protocol, we’ll include the data we collected from our first five participants, a regression interpolation spreadsheet to automatically fill out the rest of your charts, and even a few charts you can use if you don’t have any devices like OpenBarbell at all.

‘How Do You Coach’ Two Minute Survey pt.1, warm-ups. (win a free RepOne device)

Besides raising funds, filing for patents, prototyping hardware, hiring talent, building our data science, and managing to lift every once in a while, we still find time for our bread and butter, building the RepOne Platform. Our co-founder John Lin, the same John Lin who built the SoulCycle iOS app, is doing some amazing things right now with our Athlete Kiosk app and Coaching Portal. Each new build makes us more excited to get RepOne into weight rooms and we’re working as fast as we can to do so.

When building a platform as novel as RepOne, there are a lot of fundamental questions that don’t have clear answers. We tend to follow the build, measure, learn process to develop software, but re-building things that don’t work well is a great way to increase launch dates. That’s why we’re creating our ‘How Do You Coach’ survey series, where we ask one main question in each blog post so the community can help us get to V1.0.

If you want a chance to win one free RepOne device when we launch, you can choose to add your email address in the form below. The person who filled out the most surveys when we ship our first batch will win. If multiple people filled out all of our surveys we’ll pick one person from that group at random.

Click here to access the form if it doesn’t load inline below.


As usual, feel free to send us an email with any questions. We’re very interested in your feedback about RepOne, keep an eye out on our social media and blog for new app features, content, and more!

Thanks, Jordan Founder @ RepOne Strength

What you can and can’t do with a Linear Position Transducer

This blog post was inspired by a few questions I was asked by the strength staff at the LA Dodgers, and something we hear often. In short, what do you do with this thing? The answer is you can do quite a lot, but stepping back and looking at it from a high level, it’s an interesting question. I think the real value of RepOne and OpenBarbell is in individualization of training variables. Mostly load, volume, rest times, and to a lesser extent training frequency and prescriptive accessory lifts. With full autoregulation of load and volume alone research shows significant improvements in athletic performance (APRE). This is traditionally applied with velocity cutoffs, velocity loss, velocity thresholds, 1RM estimation, etc.


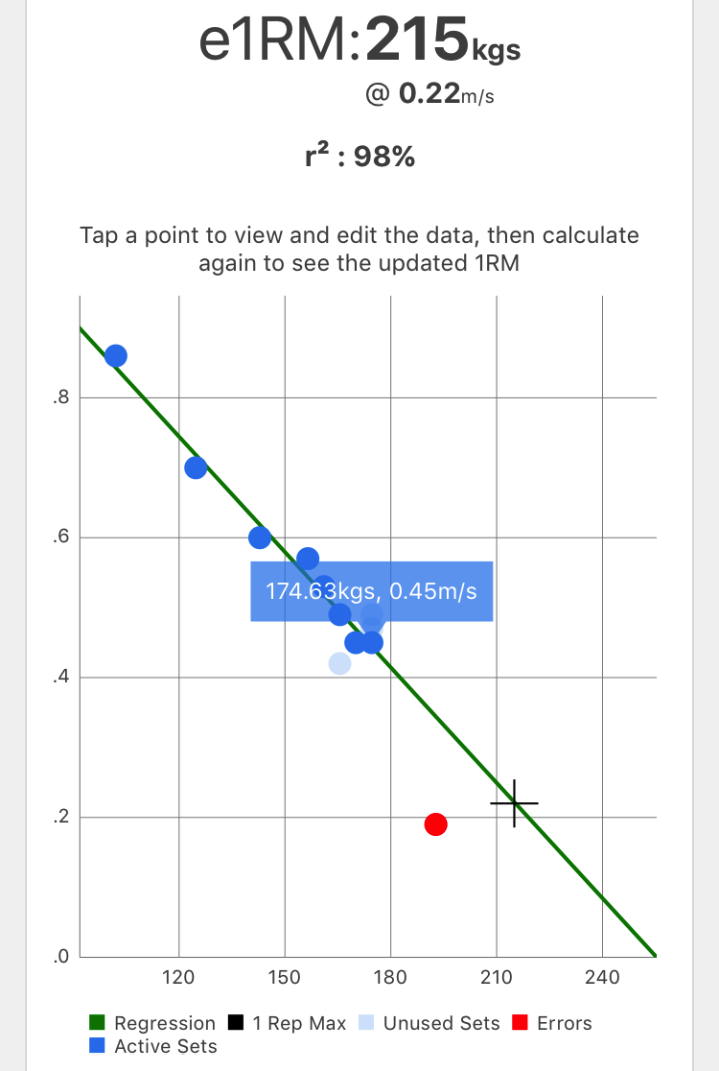
A velocity RPE chart is one of the best context tools in VBT

Like any other genuinely useful data acquisition tool, a Position Transducer provides context within which coaches can make decisions. Strength coaching without data is like navigating your living room in the dark. Sure, you know the fundamentals like where your couch is, how far until you get to the fridge, the approximate location of the sharp corner of the coffee table, but why risk your shins and toes when simply flipping on the lights can help you get to that mint chocolate chip in record time? This is why the sports analytics market is growing at roughly 40% per year. Coaches and trainers know that they’re surrounded by the information they need to make that great decision, they just need to figuratively turn on the lights.

So what can you do with a simple product like OpenBarbell on day one? Without the depth of context we use when, for example, choosing attempts for Squats & Science athletes in competition, you can still use data to impact training decisions. In fact, methods developed by strength authorities like Dr. Bryan Mann and Louie Simmons detail easy to implement strategies that can be applied to an entire team out of the box. Simple ideas like generalized velocity bands and dynamic effort thresholds can make VBT easy enough for the most inexperienced freshmen athletes.

So what are your options if you wan to implement some of the more individualized autoregulation and Motion Based Training features, like those enabled by RepOne? That’s a question we’ve spent a lot of time thinking about, both at the team and athlete level. Velocity targets autoregulate on an individual level by default, but the targets themselves can be specific on an individual level.

“[Peak Velocity, Mean Propulsive Velocity, and Mean Velocity] are reliable and can be utilized to develop LVPs (Load Velocity Profiles) using linear regression. Conceptually, LVPs can be used to monitor changes in movement velocity and employed as a method for adjusting sessional training loads according to daily readiness.”

We’ve seen coaches implement complex paper card systems, and depending on the amount of resources available, coaches can use the data on these cards to build the context needed to make true autoregulatory decisions. If you don’t have a large staff or a small group of athletes, you’ll need software that can manage these large volumes of data.

Another common question we get is about F-V curves. There’s an interesting distinction to be made between mechanical force and force output via muscle contraction.

“Other studies have indicated that methods that depend only on kinematic and kinetic results have limitations when used to determine power output (Cormie et al., 2007b; Hori et al. 2007). It seems that the linear position transducer technique overestimates power due to increased force output production derived from double differentiation of bar displacement. When this technique is applied also to the mass of the subject, standard biomechanical procedures are rejected in that force is determined without considering the acceleration produced through a movement (Dugan et al., 2004). Despite this limitation, our results indicate that monitoring bar velocity is a useful procedure to control load intensity in resistance exercises, as observed by other authors (Hori et al., 2007; McBride et al., 2011)” — Garnacho-Castaño”


Load-velocity curves are another great context tool in VBT

This is one of the reasons we haven’t developed a power or force metric in the OpenBarbell app. You can easily implement both power and force metrics in Kinduct with our data, but it’s a bit misleading. If you want to develop a true f-v curve you want to use OpenBarbell in conjunction with a force plate. You can fake a f-v curve with one or the other, but they both have limitations. That being said, a load-velocity curve, which is what OpenBarbell can measure alone, is very useful and should be measured either on a continuous basis or should be evaluated as frequently as each mesocycle.

The Emergence of Motion Based Training

And the Era of the Individual

“Claims that cannot be tested, assertions immune to disproof are veridically worthless, whatever value they may have in inspiring us or in exciting our sense of wonder.”

— Carl Sagan, The Demon-Haunted World: Science as a Candle in the Dark

Takeaways:

  • We aren’t using position/motion tracking tech in Strength Coaching because it doesn’t exist (yet)
  • Position/motion tracking seems to be the logical conclusion to sensing the training metrics that most strongly correlate to outcomes/wins
  • Motion Based Training is poised to be as powerful in Strength Coaching as just about any other analytics system in sport

In competitive sports, the most important metric at the end of the day is a simple binary — did you win, or did you lose? This unforgiving fundamental nature is liberating in a way. Excuses, beliefs, and feelings don’t matter, what matters is objective truths we all share and experience, because when the dust settles there is either victory or loss.

The impact of sports’ inherent objectivity on the way we train athletes is similarly straightforward. If a system or methodology produces results it will survive the test of time. In their preparation for the Olympic Games, coaches in ancient Greece believed harmony in movement was integrally important to training success, so they would make sure there was at least one flute player at each practice, often synchronizing the flow of training with the melody. While music still plays a prominent role in training, I’m not familiar with any high profile programs that still employ flutists.

As the strength and conditioning world ebbs and flows over time, picking up a few ideas and technologies, leaving a couple behind, the filtering mechanism of wins and losses moves us slowly closer to what is optimal. Something worthy of note in this optimization algorithm is the simple fact that our industry can only create methodologies around tools for which a technology exists, and it can only employ methodologies for tools that are logistically useful. Put another way, if a technology doesn’t exist to, for example, train under increased gravity, then we cannot build the systems around it to integrate the technology into our workflow.

Compounding the impact of this fact is the reality that paradigm shifting technologies are rarely created specifically to help teams win games, but rather are borrowed from other industries. Viewed through this lens, we can start to understand how the role of technology in Strength and Conditioning got to where it is today. Heart rate sensors, strain gauges, even GPS and GLONASS technology existed in other forms before they were training tools. If we look at emerging technologies like Computer Vision, Narrow AI, Additive Manufacturing, etc., we can try to envision the future landscape of strength tech.

I’ll be focusing on two kinds of innovation: the improvement in quality or reduction in cost of existing systems or tools, and the creation or invention of completely new technologies. They are not mutually exclusive, in fact one is usually accompanied by the other. The main purpose of the differentiation is to highlight two key areas of focus of strength tech in the near future.

Motion Based Training

Our industry can only create and employ methodologies around tools for which a technology exists. That statement reads as obvious, and I don’t mean to sound as if I’m relaying a gem of wisdom I’ve mined over the past few years. I say it because the idea is a useful tool in figuring out why we train athletes with technology the way we do.

Take for example Velocity Based Training. Velocity acquisition devices have been around for decades. In fact one of the most basic patents for linear position transducing in an exercise application is set to expire soon. Louis Simmons is credited for introducing use of the Tendo FitroDyne to strength training back in 2002 in a Powerlifting USA article. If you take a look at the search interest in ‘velocity based training’, it took years after that for it to start gaining consistent momentum.
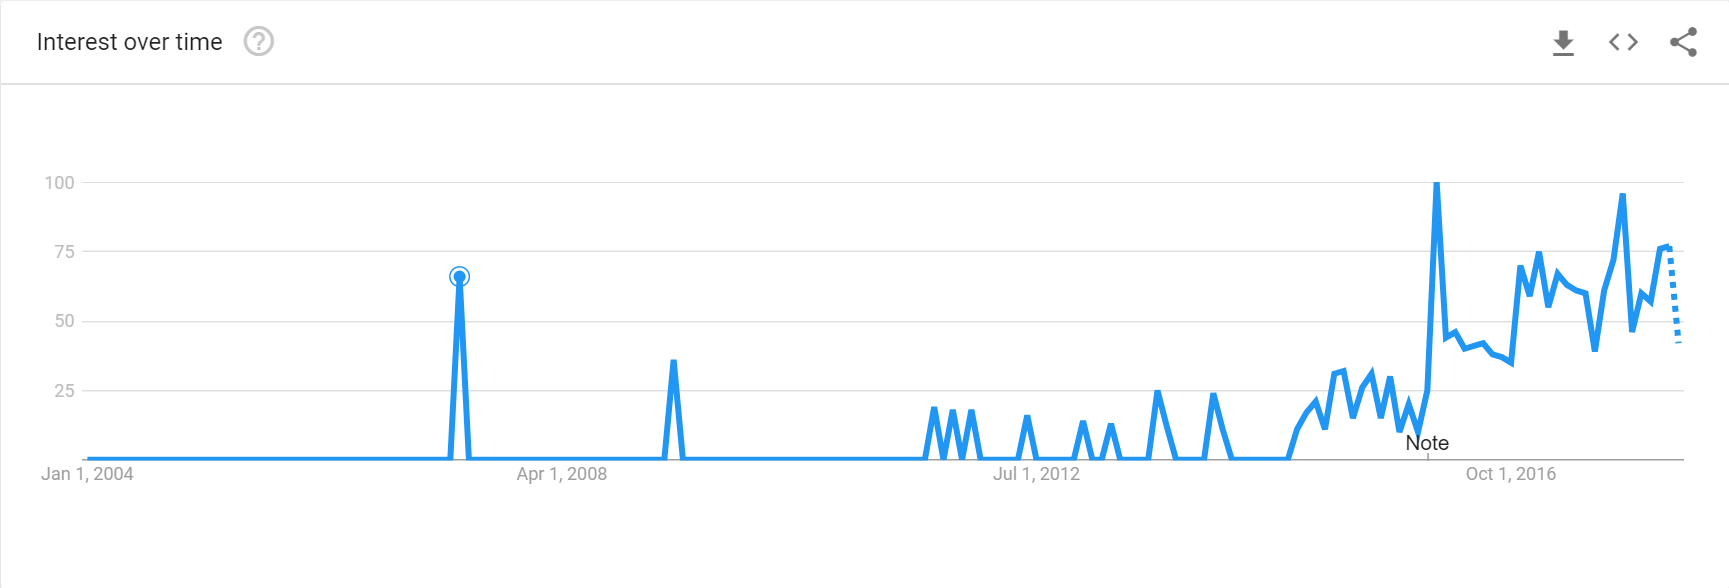
This data aligns with our desire back in 2013 to introduce low-cost, easy to use VBT devices. The technology was created, the methodologies were developed, tools became more accessible and easier to implement, and now velocity as a training metric is common language in strength.

Even though we’ve invested a lot of time and effort into VBT, we’ll be the first to mention its limitations. Autoregulatory measures like velocity and RPE vary on an individual basis, but it has proven quite difficult to figure out what factors are involved in this variability. There is a clear relationship between mean concentric velocity and RPE, but accurately predicting 1RM with velocity across populations is not such an easy task (which is why our tool is so flexible). That isn’t to say velocity and other autoregulation techniques are ineffective. They work quite well and can be impactful in myriad of ways. So where is this information gap coming from?

Data accuracy and subjective measures
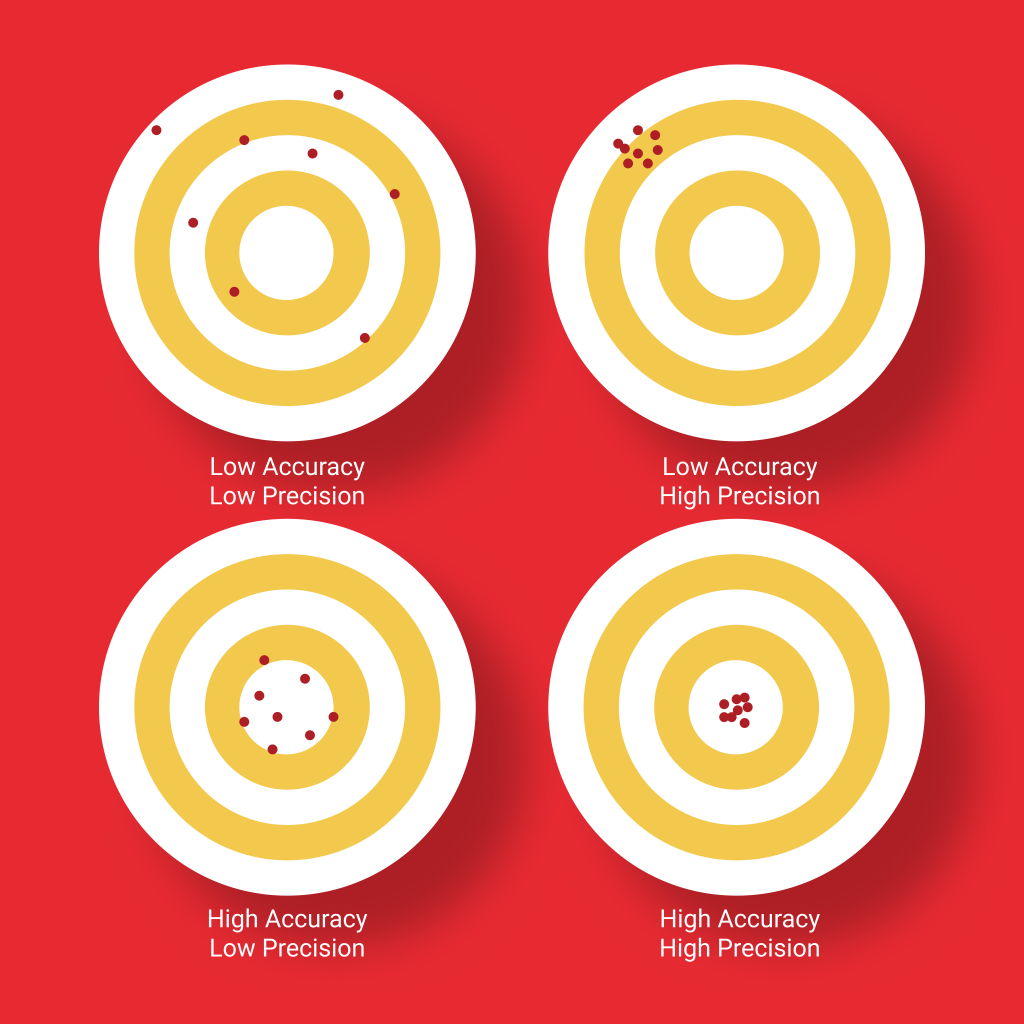
 

Data accuracy is incredibly important. Unbeatable accuracy has been a top priority of ours since we started building VBT products and will be for the foreseeable future. In the beginning of our quest for absolute accuracy we figured out a big problem in velocity tracking in general. Although our precision was high, and our accuracy within the constraints of a linear position measurement were very high, the real-world accuracy of one-dimensional measurement in general left quite a bit to be desired.

Our teaser remained a mystery to a surprising number of people (it’s a snatch bar path)

Humans, which constitute the majority of professional athletes, do not move in one dimension. They don’t even move in two dimensions. Every time you’ve ever moved it was through three spacial dimensions, and any mathematical model or lesser dimensional sensor will only be able to produce, at best, a close approximation of the real world movement you just did. To be fair, even a three dimensional sensor will only be able to produce a close approximation, but the ceiling on the accuracy and precision of a position measurement goes up significantly with such a device.

I’ve heard the argument that accuracy takes a backseat to precision in measurement tools for sport, because as the argument goes, as long as the measurements are repeatable then it’s good enough. This is inaccurate enough to be a topic for another blog post. If a tool is precise and not accurate, and its measurements are repeatable across several devices and consistent enough to be comparable to other users, then in the top right situation in our accuracy/precision picture above, we could just shift the results every time by the same amount and the tool would then be both accurate and precise. There’s a reason that’s not realistic.
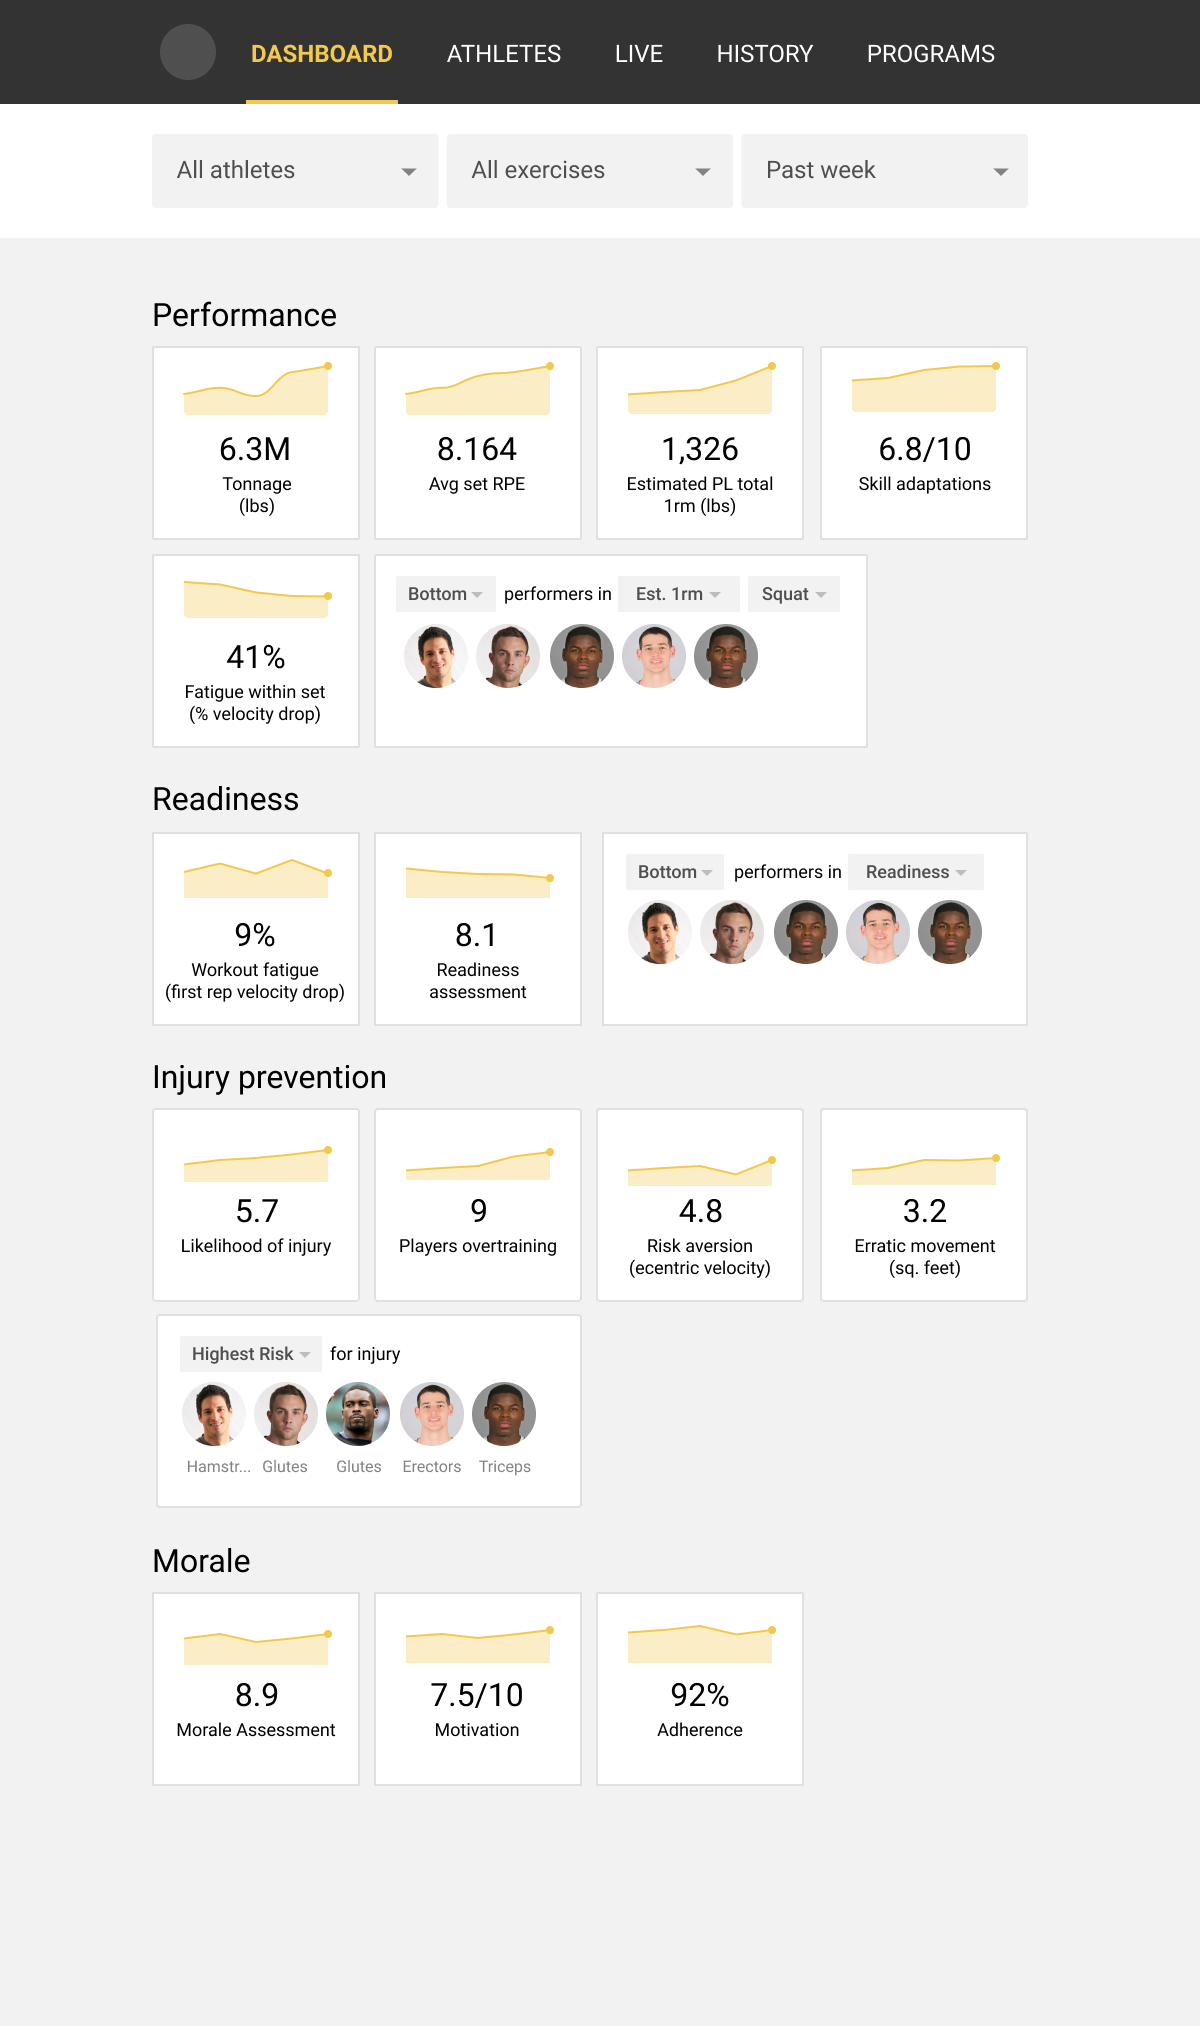
That being said, the utility of 3D position sensing in strength training goes far beyond increasing accuracy and precision. Once we can ascertain the real-world position of an object (or a point on an object) and can tie it to an athletes identity over a duration of time, we can do some seriously interesting stuff. Everything from skill adaptations (object path analysis) to inter and intra-set fatigue, overall readiness, likelihood of injury (erratic movement, lateral movement, abrupt pattern changes, etc.), risk aversion (eccentric velocity and subjective measures), and much more, can be tracked. This is enough content for an entire series of articles to come and gets to the core of the Motion Based Training approach.

Some of these qualitative metrics can only be measured in conjunction with subjective data, like morale and motivation. Collection of that data, usually in the form of athlete readiness assessments, has been growing in popularity for a good reason. It can be easyto administer to athletes, has been shown to be valid, and measures like subjective well being can be a powerful predictive tool for performance.

Tracking fatigue can be just as valuable, or even more valuable, than tracking velocity in strength sports. In a conversation I had with Travis McMaster of the University of Waikato in New Zealand, he mentioned how his velocity transducers are utilized nearly exclusively for the purpose of fatigue tracking.

Beyond our intuitive understanding of the matter, current research shows how closely change in velocity is correlated with fatigue in strength training. We also see signs in our own data that align with what’s known about self-reported motivation and its correlation to athlete burnout. The relationship to what an athlete reports via RPE, what we measure with velocity, and the athlete’s motivation and rate of overtraining and burnout, are great subject matter for future research.

The Physics Is in Our Favor

The cornerstone of the Motion Based Training approach is the idea of taking velocity for granted. Strength coaches are fortunate for several reasons, and high on the list is the fact that physics and mathematics loves weight training. The duration of a rep/set is brief, the displacement is short, net work is zero, inertia makes measurement easier with increasing weight, and the list goes on. If a position measurement tool is accurate enough and precise enough, it would make sense that basic movement variables could be highly predictive. If that tool is also easy enough to use and scalable to an entire team, we can enable coaches to make training decisions with a depth of knowledge that is rivaled only by the most advanced sports analytics technologies.

So why isn’t 3D position sensing currently utilized in strength training? The simple answer is that it doesn’t yet exist in consumer electronics. High spacial resolution position sensing is incredibly difficult even in high price, mass market products. We’ve evaluated technologies like Inertial Measurement Units (IMU’s, AKA accelerometers), ultrasonic sensors, IR range finders, Ultra Wide Band sensors, altimeters, GPS, and many others, only to find out what Apple, Samsung, and Facebook already knew — we weren’t going to find it. True high fidelity wireless position sensing likely won’t trickle down into a sensor we could simply plug into our product for several more years. When it eventually does, there’s no guaranteeing it’ll be accurate enough, scalable enough, easy enough to use, or affordable enough for use in strength.

We figured this out years ago and began working on specialized technology to accomplish exactly what we need. It took dozens of prototypes to get the sensing to where it is today, and we think it’s exactly what coaches need to enable Motion Based Training. We’ll talk a little more about our novel tech at a later date, and we’ll be working with several third parties to validate the output of our sensing.

The Future of Strength Tech

I’ve been asking coaches for a little while now what they think the weight room of the future will look like. In each response there is some aspect of movement sensing. Usually tablets on each training station, and an intelligent system that can interpret the deluge of data extracted from athletes. In fact there are some great companies in sports tech who share a similar vision of the future, and a lot of our customers have already outfitted their racks with tablets for things like session timing and workout logging.

Another clear trend we hear in these predictions is automation. Coaches tell us they want access to a ton of advanced metrics that they can “interpret quickly” with “no data analysis team needed”. A few of our customers are private sports training facilities who’s clients pay top dollar to access some of these futuristic training methods right now. The limitation is the expense of the analysis, delayed feedback, and coach-to-athlete ratio. In order for this kind of service to become the new normal in the weight room of the future, the data analysis needs to be automated so coaches can access simple reports and decisions can be made within minutes, or even seconds after the data is collected.

Even after coaches review our website and sign up for updates, they still imagine the above-described future weight room as being 10 to 20 years away. This is for good reason since, for the reasons described above, there has been no significant advances toward that future for decades. The concept of Motion Based Training isn’t meant to be a phrase adopted by the ‘industry’ or used as a replacement for any other ideas. The phrase is just a tool we’ve been using to communicate to coaches that the weight room of the future isn’t as far away as they think. In fact, we think it’s right around the corner.

If any of this sounds interesting to you, head over to RepOneStrength.com and sign up to stay in touch. If you want to help kickstart the Era of the Individual, simply share this article to Strength and Conditioning coaches or people influencers in the space. We’ll be sending email updates out periodically in the coming weeks in months as we head towards pre-orders this summer.